

Issue #49 // Information Theory Gets to The Heart of Biometric Analysis
Using Mutual Information, Granger Causality, and Transfer Entropy To Understand Causality In Time-Series Biometric Data


Enjoy this piece? If so, you can show your support by tapping the 🖤 in the header above. It’s a small gesture that goes a long way in helping me understand what you value and in growing this newsletter. Thanks!
Issue № 49 // Inførmatiøn Theøry Gets to The Heart of Biømetric Analysis
Our bodies are broadcasting stations, constantly transmitting signals about their internal state. With each heartbeat, breath, and metabolic reaction, we generate a massive volume of physiological data. In the 10+ years I worked with Olympians, professional sports teams, and human performance groups within the DoD, our ability to intercept and measure out bodies signals evolved dramatically, beginning with rudimentary tools— heart rate monitors strapped to athletes' chests and finger-prick glucose readings— and expanding to include dozens of real-time biometric readings.
As wearable technology has proliferated, it’s allowed us to simultaneously track heart rate variability, muscle oxygenation, blood lactate, respiratory patterns, and more. With each new sensor, we’ve added another stream to the river of biological data, promising deeper insights into human health and performance. The wearable industry’s mantra became clear: more data = better understanding.
Yet, this explosion in the amount of data we’re collecting hasn’t delivered the proportional increase in understanding we’d expected. The problem isn’t our collection capabilities or the wearables themselves — it’s our analytical approach. As a society, we’ve confused data with information. While data encompasses the raw measurement values we collect— information conveys meaning through relationships and structure. Simply accumulating more metrics without understanding their causal relationships is like intercepting more radio frequencies without knowing how to decode the messages they contain.
To extract genuine insight from our physiological measurements, we need to move beyond asking what changes are occurring to determining why they're happening and which variables are driving which outcomes. When exercise intensity increases, does heart rate drive ventilation changes, or vice versa? When blood glucose rises, which regulatory mechanisms respond first, and which follow? These questions about causality are the key to unlocking actionable physiological insights.
Information as Uncertainty Reduction
The mathematical foundations for addressing these questions concerning causality in came from an unexpected place— Bell Laboratories in the 1940s, where Claude Shannon developed what we now call information theory. Shannon wasn’t thinking about applying his ideas to heart rate variability or muscle oxygenation. He was solving the problem of how to efficiently transmit messages over noisy telephone lines. Yet his mathematical framework for quantifying information would eventually transform fields far beyond telecommunications.
Shannon's crucial insight was defining information as uncertainty reduction. Each bit of information cuts the uncertainty about a message in half. This simple concept provides the perfect foundation for understanding how physiological systems communicate with each other. When muscle oxygenation drops, how much does that tell us about what respiratory rate will do next? Shannon's mathematics gives us a way to quantify this.
Mutual Information — Beyond Simple Correlation
The first tool in our information-theoretic toolkit is mutual information, which measures how much knowing one variable tells us about another. Unlike correlation, which captures only linear relationships, mutual information detects any statistical dependency, making it ideal for biological systems with complex, non-linear interactions. Mathematically, mutual information between two variables X and Y is defined as:
This formula compares the joint probability distribution p(x,y) with the product of marginal distributions p(x)p(y)1. When variables are independent, p(x,y) = p(x)p(y), making the fraction equal to 1 and the logarithm equal to 0. Alternatively, the greater the statistical dependency between two series of data, the more the formula's value increases.
Consider muscle oxygenation and respiratory rate during exercise. Traditional correlation might tell us these variables move inversely—when muscle oxygenation goes down, breathing rate goes up. Mutual information goes further, quantifying exactly how much uncertainty about respiratory rate is reduced when we know muscle oxygenation. For example, if mutual information between these variables is 2 bits, it means knowing muscle oxygenation reduces our uncertainty about respiratory rate by the equivalent of two yes/no questions.
However, mutual information has a critical limitation: it's symmetric. It can't tell us which variable influences the other. Does declining muscle oxygenation cause respiratory rate to increase, or vice versa? For this directional insight, we need to integrate time into our analysis.
Granger Causality — When the Past Predicts the Future
In the late 1960s the economist Clive Granger introduced a concept for testing causality in time series data, which would later earn him the Nobel prize. His insight was brilliantly straightforward—if past values of X help predict future values of Y beyond what past values of Y alone can predict, then X is said to "Granger-cause" Y.
In physiological terms, Granger causality could test whether historical values of muscle oxygenation improve our prediction of future respiratory rates, for example, beyond what past respiratory rates themselves tell us. Mathematically, this involves comparing two models: a restricted model and unrestricted model, as demonstrated below.
The restricted model includes only past respiratory rate values, expressed as Bt-1, whereas the unrestricted model uses both past respiratory rate values and muscle oxygenation values, expressed as At-1. Additionally, in both models Bt represents respiratory rate at time t, ε is the error term, and the parameters c, α, and β are estimated via regression.
In the unrestricted model significantly outperforms the restricted model— evaluated using an F-test comparing the residual sum of squares— we conclude that muscle oxygenation Granger-causes respiratory rate changes. This analytical approach has been implemented in PhysioNexus, an open-source tool I developed that maps causal networks in physiological data2. Notably though, Granger causality primarily detects linear relationships and assumes stability in the time series. For the non-linear, dynamic relationships common in physiology, we need something more robust.
Transfer Entropy — Shannon Meets Granger
In 2000, physicist Thomas Schreiber published a paper introducing transfer entropy—a concept that combines the non-linear sensitivity of mutual information with the directional aspect of Granger causality. Transfer entropy measures the directed flow of information from one time series to another by quantifying how much uncertainty about one variable's future is reduced by knowing another variable's past.
This equation quantifies the additional information that variable A’s past, at, provides about variable B’s future, bt+1, beyond what B’s own past bt provides. The equation compares two conditional probabilities: p(bt+1|bt,at), which is the probability of B’s next value given both B and A’s current values and p(bt+1|bt), which is the probability of B’s next value given only B’s current value.
Simply put, transfer entropy asks: "How much better can I predict respiratory rate's next value if I know both past respiratory rates AND past muscle oxygenation, compared to knowing only past respiratory rates?" The difference, measured in bits, represents information flowing from oxygenation to respiration.
What makes transfer entropy particularly valuable for physiological analysis is its flexibility. It doesn't assume relationships are linear or require normally distributed data — it simply measures the flow of information, making it idea for the complex, non-linear, dynamics of living systems.
Practical Challenges in Physiological Causality Analysis
While these information-theoretic approaches hold tremendous promise for mapping cause-and-effect relationships in time-series physiological data, there are some practical challenges we have to contend with. At the level of individual biometrics, we need to consider noise sensitivity. Physiological signals contain natural variability and measurement noise — heart rate includes respiratory sinus arrhythmias, blood oxygenation readings are sensitive to motion artifacts, and so on3.
When we expand our analyses to include multiple biometrics, additional factors come into play. For example, different biosensors sample at different rates—heart rate monitors may provide beat-by-beat data while muscle oxygenation is measured in a continuous fashion, anywhere from 2-100Hz. Synchronizing these disparate data streams without introducing artifacts requires careful analytical approaches.
Abstracting out further, we need to consider that many physiological measurements change their statistical properties over time. Exercise intensities and fatigue states vary, recovery periods introduce state shifts. and circadian rhythms create natural cycles. Information-theoretic measures generally assume stationarity, requiring additional techniques to address this challenge.
Despite these challenges, the potential insights are worth the effort. Understanding true physiological cause-effect relationships enables intervention at the source level rather than treating downstream effect—the difference between prescribing a cooling protocol when increased muscle temperature drives performance decrements (ie, taking advantage of cause-effect-relationships) versus generally hydrating when observing increased heart rate.
The Path Forward — Information Theory as A Physiological Compass
What makes information theory particularly suited to physiological analysis is its inherent respect for complexity. Unlike reductionist approaches that segment the body into isolated systems, information-theoretic measures embrace the interconnected, non-linear nature of biological networks.
The practical implementation of these methods requires an integrated approach. First, we need biosensor development that prioritizes synchronization—multiple data streams sampled at compatible frequencies that can easily be temporally aligned.
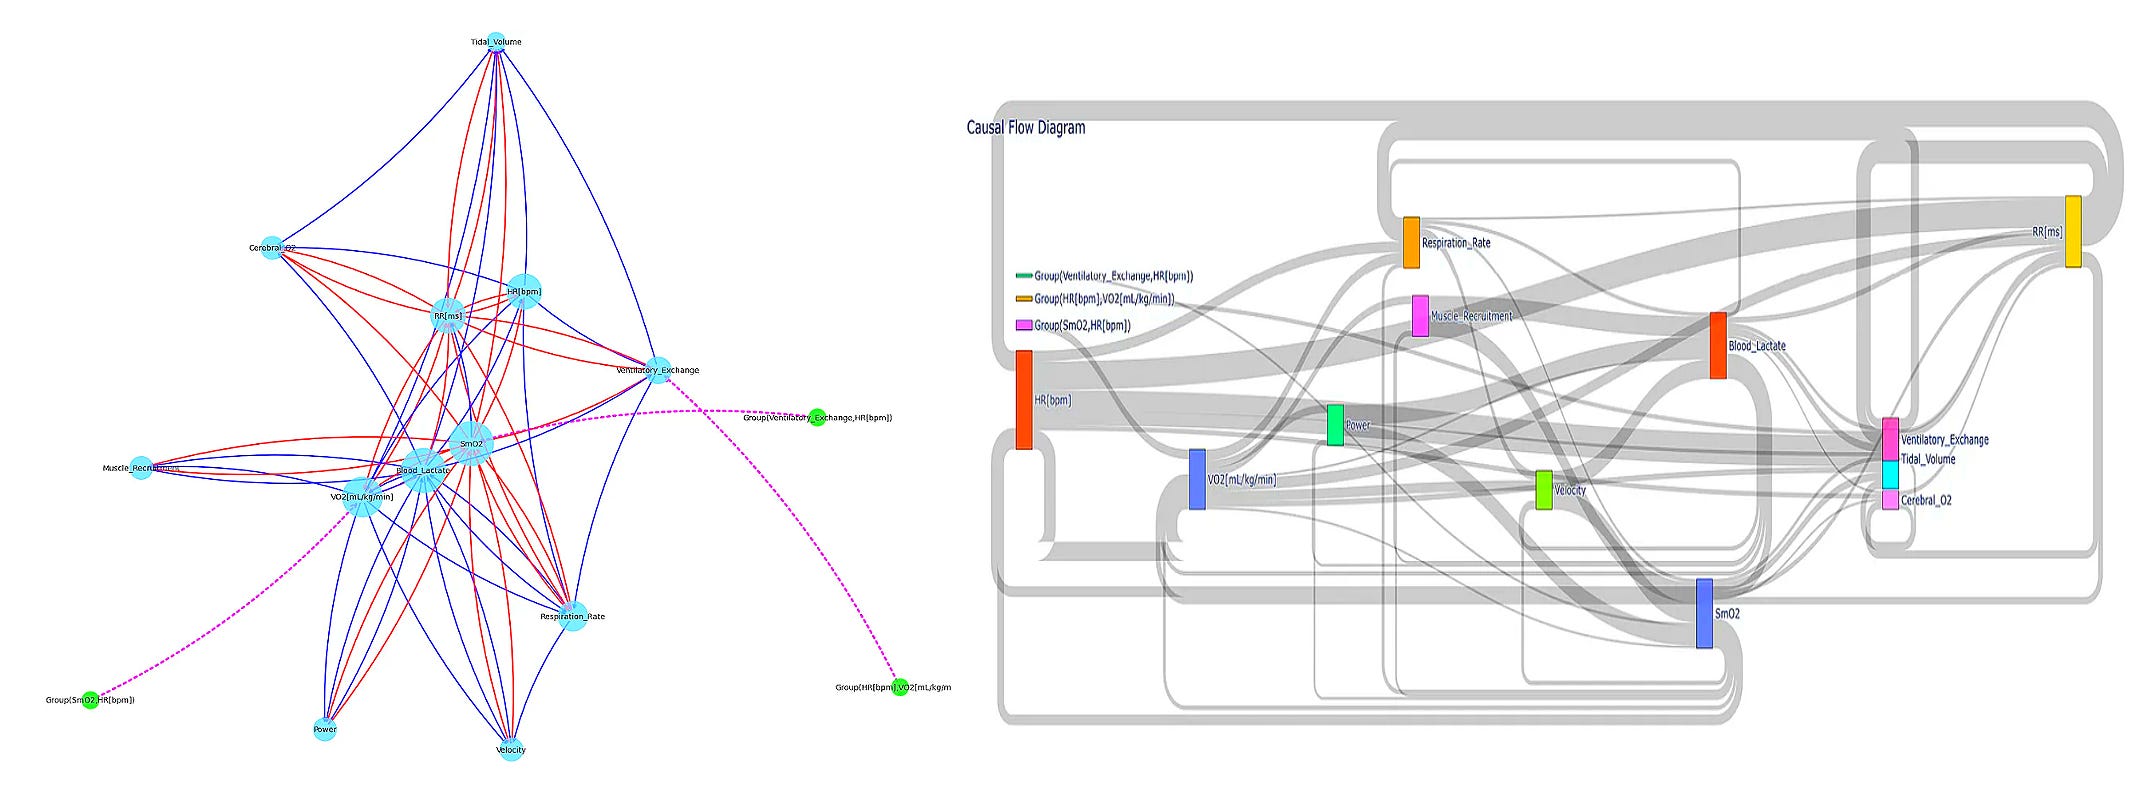
Second, we must develop visualization tools that communicate causal networks intuitively. Traditional time-series plots and correlation matrices fail to capture directional information flow. PhysioNexus tackles this by generating network diagrams with weighted, directed edges that clearly communicate which physiological variables drive others. These aren't just static visualizations—they're functional, navigable tools revealing the operational architecture of an individual's physiology.
Third, we need to move beyond superficial composite scores from wearable devices to explanatory models. When an athlete's performance declines, they don't need to know their "recovery score" dropped from 87 to 62 or yesterday’s "strain" was 18/21 —they need to understand which physiological systems are causing the cascade and what specific interventions would address those root causes4.
Finally, and perhaps most importantly, we need a conceptual shift in how we think about physiological monitoring. Moving from "what is happening?" to "what is causing that to happen?" represents a fundamental change in approach. This shift doesn't just enhance our understanding—it transforms how we intervene, optimizing training protocols, medical treatments, and recovery strategies by addressing root causes rather than downstream effects.
The revolution in physiological monitoring I'm describing isn't the future—it's happening now. PhysioNexus represents one step in this direction, with open-source code available on GitHub for researchers and practitioners to implement, test, and extend. Future development will incorporate multi-scale analysis to examine relationships across different timescales, risk analysis, and eventually predictive differential equation models that can simulate interventions before implementation.
For researchers, clinicians, and performance specialists reading this, I encourage you to move beyond correlation in your analyses. Examine directionality. Test for information flow. Ask not just whether two variables move together, but whether one drives the other.
In a world awash with physiological data, information theory offers not just another analytical tool but a fundamentally different compass for navigation. By identifying causal pathways amidst the physiological noise, we can finally understand the body as it actually functions—not as a collection of isolated metrics but as an integrated network of cause and effect, of information senders and receivers, of complex dynamics that cannot be reduced to simple correlations or arbitrary composite scores. The future of physiological monitoring lies not in more sensors, but in smarter mathematics that reveal the body's true causal architecture.
Interested in working together? I advise small companies, startups, and VC firms on topics ranging from biosensor development, multiomics and biometric data analysis, network modeling, and product strategy. Contact eva♦peiko♦@gmail.com (replace the ♦ with n) for consulting inquiries or newsletter sponsorship opportunities.
To give an example, let’s say we have two time series measurements. Measurement A includes the series 1,1,3,4,5 and measurement B includes the series 5,5,7,8,9. To find the joint probability p(x,y) of a given measurement pair we divide its frequency by the total number of measurement pairs. For example, the measurement pair (1,5) occurs twice, thus p(1,5)=2/5. The marginal distributions on the other hand represent the probity of a single x or y measurement occurring. For example, in measurement series A the marginal distribution of the value 3, p(3), is 1/5.
PhysioNexus adapts bioinformatics techniques used in gene co-expression networks for time-series physiological data, visualizing the results as directed network graphs where nodes represent physiological variables and arrows show causal relationships, with thickness indicating statistical strength. If you’re interested in learning more about this tool, you can check out a previous article I wrote titled Breaking Biometrics Babel.
I’ve written about this topic in-depth in Dampening the Noise: Making Sense of Variability In Biometric Measurements.
PhysioNexus has already revealed interesting insights in this area, such as identifying "peripheral dominant" athletes whose performance is primarily driven by muscle oxygenation, blood lactate, and muscle recruitment patterns rather than cardiovascular factors—fundamentally changing how training should be approached for these individuals.
Very interesting and simply explain. I am from biology background and often then maths behind the algo holds me back. Thanks for this insight.